GeoQetriX Map Roadmap
Of course I know it will never come even close to Google Maps or OpenStreetMap and I don’t even want to. My personal motivation is to be able to use my own maps for general purposes, like place locators.
So, I’m going to include administrative divisions, preferably up to city boroughs. Plus major roads, major railroads, major rivers and major streets. I have to come up with some compression, I’d like to be able to define, how detailed the export (SVG, PNG) should be. So far I can do it with all lines loaded, which is quite resource inefficient.
GeoQetriX Map
I presented the idea of GeoQetriX [2013/05#geoqetrix more than a year ago], but finally I got the urge to make it done. I’m gonna to redo my website about “USA thru Czech Eyes”, so I wanted interactive maps. I found some JavaScript libraries, based on Raphaël, and using SVG paths for countries.
So I downloaded some countries. And some more countries. And this country, this one, and... but at least one of them was missing. So, as one might expect, it brought me to an idea to do it on my own (to have them all). I’m gonna to need them anyway at some point, so why not now?
Because Google Maps JavaScript API is truly extraordinary, I didn’t think twice how I’m going to do the editor.
So. I put some geographical points (using markers) on the map and stored them in the database. They were basically major country border joints and major shore features. In the very first version, the editor generated SQL INSERT commands, which I executed manually in HeidiSQL.
Then, of course, I had to stop being lazy about DB support and created a script to generate JSON for markers on the map, later for lines as well. Markers and lines both have a type, with semantic meaning (shore border, inland border, division border...).
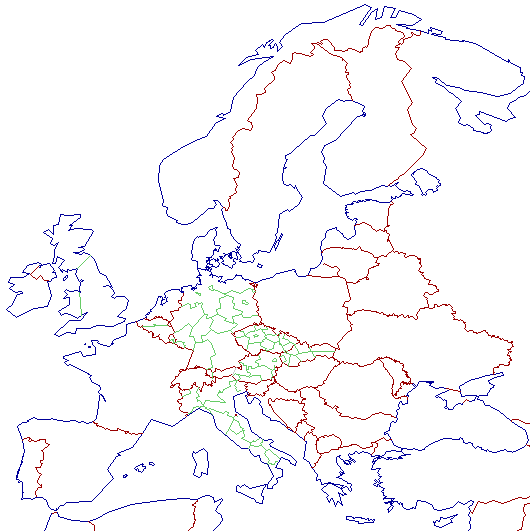
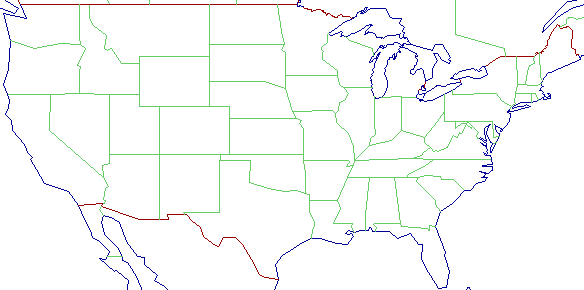
Except for the Google Maps I created a secondary output, into generated PNG. For debug purposes I assigned different colors to each type (blue for shore, red for inland, green for divisions, gray for subdivisions). And started clicking. And clicking... But after a while I was quite excited about the (still work-in-progress) result:
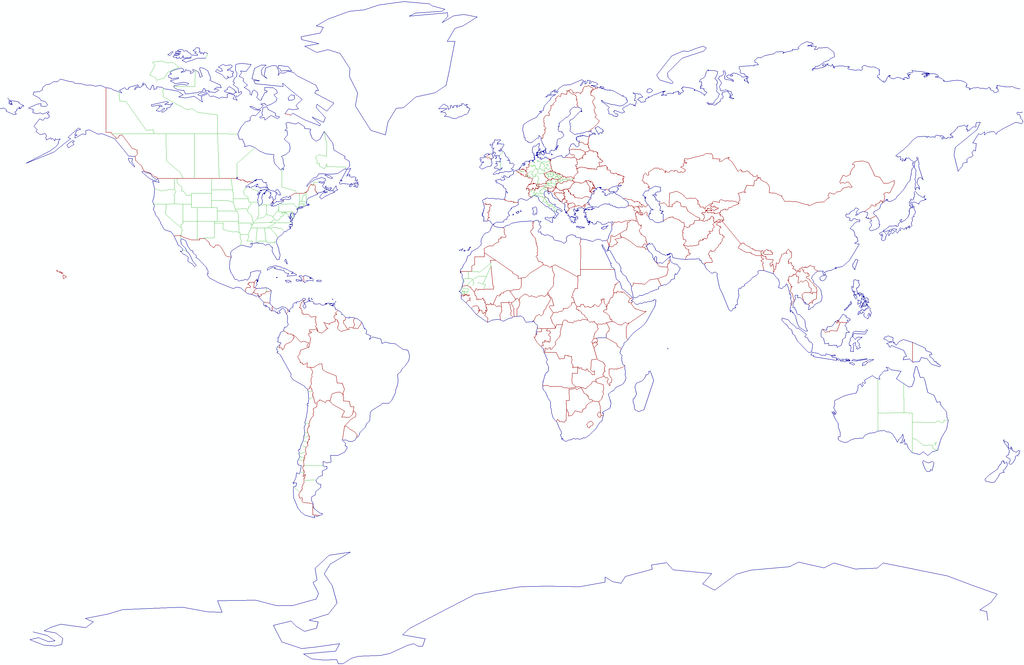
Along the way, I adjusted something here and there. The editor has to be very easy to use, because I guess I’m gonna spend quite a time in it. I want to have major roads and railroads, along with water.
I also had to use a projection for the map output. I chose Miller (EPSG:54003 – World Miller Cylindrical), because personally I like it the most; for me it’s the “classic” view.
Before the final alpha-stage map I did everything I planned to. Like placemark settings with a list of attached lines, with possibility to change type of the line, delete selected line or add a midpoint to a line.
The last thing is to define, what’s on each side of a line. At first I thought it will be the smallest unit possible (like a county, neighborhood or even a plot), but I kept thinking that querying the whole country may consist of thousands of geo-units.
After a while I realized that the other way around it would be much better, without losing much fidelity. So at this point I’ll define a country (or sea/ocean) for each line, if it’s a country border. Then state borders, county borders and so on. If I would like to draw a country, I simply ask for all lines with it’s ID.
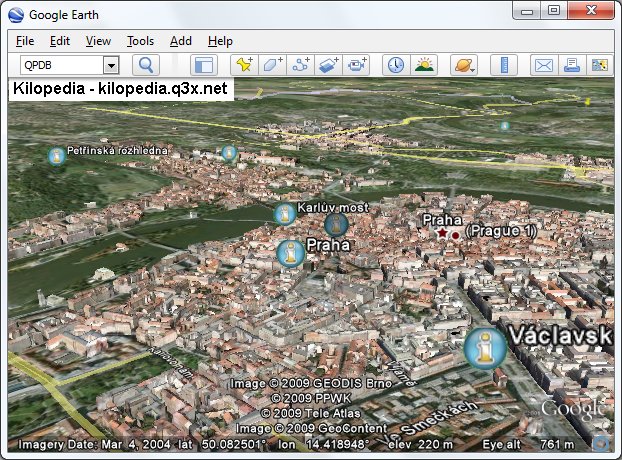
On-line placemarks in Google Earth
For Kilopedia I wanted to visualize all the places in Google Earth. The best way is to use KML on-line abilities.
For the application itself it's as easy as a simple XML file:
- <?xml version="1.0" encoding="UTF-8"?> <kml xmlns="http://earth.google.com/kml/2.0"> <NetworkLink> <name>mikiho</name> <open>1</open> <Url> <href>https://localhost/ge.php</href> <viewRefreshMode>onStop</viewRefreshMode> <viewRefreshTime>1</viewRefreshTime> </Url> </NetworkLink> </kml>
Server-side is a bit more complex, but it's still nothing difficult to do. Google Earth will send a “BBOX” GET attribute with bounding box coordinates (coordinates for top-left and bottom-right corners).
So you only need to extract those, query them in your latitude/longitude database and return appropriate XML:
- $bbox = explode(",", $_GET["BBOX"]); $res = $db->get("SELECT * FROM geo WHERE geo_x BETWEEN :0 AND :2 AND geo_y BETWEEN :1 AND :3", $bbox); echo '<?xml version="1.0" encoding="UTF-8"?'.'> <kml xmlns="http://earth.google.com/kml/2.0"> <Folder> '; while($zaz = $db->getRow($res)){ echo '<Placemark> <name>'.$zaz['name'].'</name> <description>'.($zaz['desc'].'</description> <LookAt> <longitude>'.$zaz['geo_x'].'</longitude> <latitude>'.$zaz['geo_y'].'</latitude> </LookAt> <Style> <IconStyle> <Icon> <href>https://localhost/ge.png</href> </Icon> </IconStyle> </Style> <Point> <coordinates>'.$zaz['geo_x'].','.$zaz['geo_y'].',0</coordinates> </Point> </Placemark> '; } echo '<ScreenOverlay> <name>MyPlacemarks</name> <Icon> <href>https://localhost/my-placemarks.png</href> </Icon> <overlayXY x=\'0\' y=\'1\' xunits=\'fraction\' yunits=\'fraction\'/> <screenXY x=\'0\' y=\'1\' xunits=\'fraction\' yunits=\'fraction\'/> <rotationXY x=\'0\' y=\'0\' xunits=\'fraction\' yunits=\'fraction\'/> <size x=\'0\' y=\'0\' xunits=\'fraction\' yunits=\'fraction\'/> </ScreenOverlay> '; echo '</Folder> </kml>';
As a cherry on top I added an overlay, so anybody knows what the source of all the placemarks is.