GeoQetriX Map
I presented the idea of GeoQetriX [2013/05#geoqetrix more than a year ago], but finally I got the urge to make it done. I’m gonna to redo my website about “USA thru Czech Eyes”, so I wanted interactive maps. I found some JavaScript libraries, based on Raphaël, and using SVG paths for countries.
So I downloaded some countries. And some more countries. And this country, this one, and... but at least one of them was missing. So, as one might expect, it brought me to an idea to do it on my own (to have them all). I’m gonna to need them anyway at some point, so why not now?
Because Google Maps JavaScript API is truly extraordinary, I didn’t think twice how I’m going to do the editor.
So. I put some geographical points (using markers) on the map and stored them in the database. They were basically major country border joints and major shore features. In the very first version, the editor generated SQL INSERT commands, which I executed manually in HeidiSQL.
Then, of course, I had to stop being lazy about DB support and created a script to generate JSON for markers on the map, later for lines as well. Markers and lines both have a type, with semantic meaning (shore border, inland border, division border...).
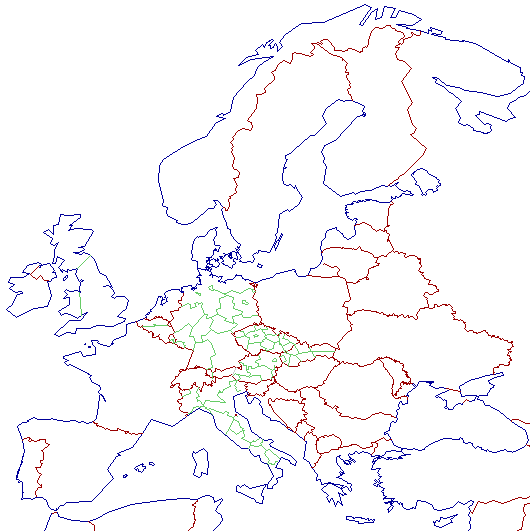
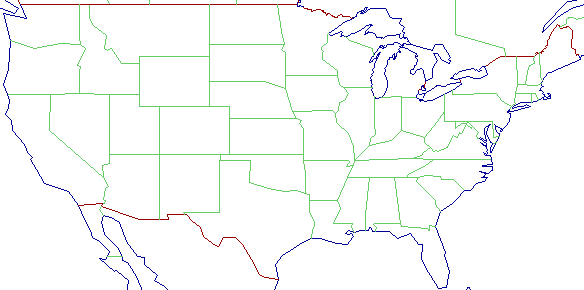
Except for the Google Maps I created a secondary output, into generated PNG. For debug purposes I assigned different colors to each type (blue for shore, red for inland, green for divisions, gray for subdivisions). And started clicking. And clicking... But after a while I was quite excited about the (still work-in-progress) result:
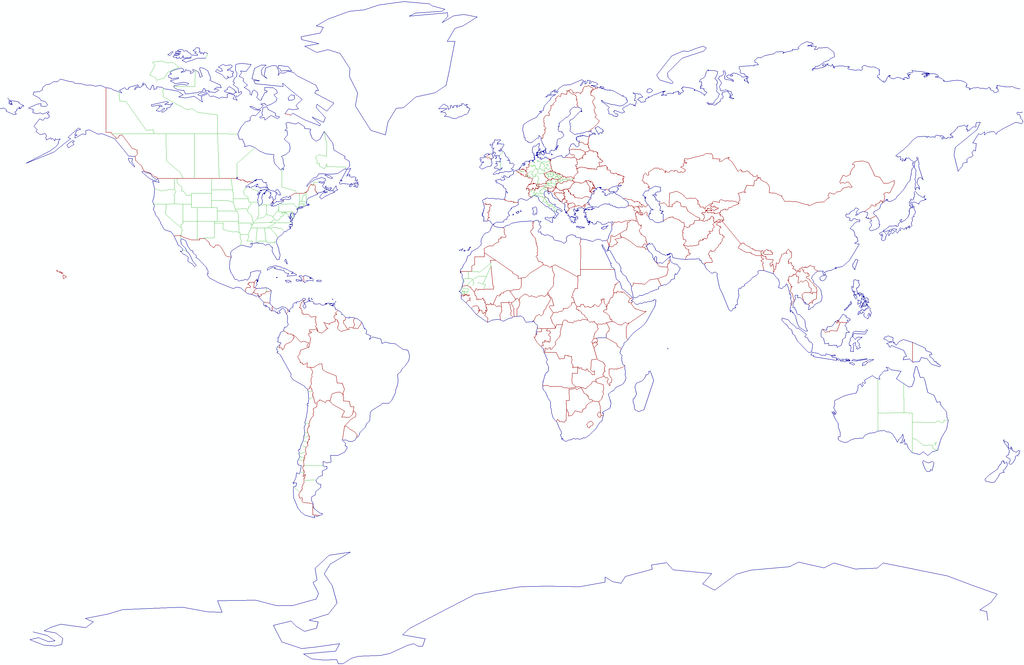
Along the way, I adjusted something here and there. The editor has to be very easy to use, because I guess I’m gonna spend quite a time in it. I want to have major roads and railroads, along with water.
I also had to use a projection for the map output. I chose Miller (EPSG:54003 – World Miller Cylindrical), because personally I like it the most; for me it’s the “classic” view.
Before the final alpha-stage map I did everything I planned to. Like placemark settings with a list of attached lines, with possibility to change type of the line, delete selected line or add a midpoint to a line.
The last thing is to define, what’s on each side of a line. At first I thought it will be the smallest unit possible (like a county, neighborhood or even a plot), but I kept thinking that querying the whole country may consist of thousands of geo-units.
After a while I realized that the other way around it would be much better, without losing much fidelity. So at this point I’ll define a country (or sea/ocean) for each line, if it’s a country border. Then state borders, county borders and so on. If I would like to draw a country, I simply ask for all lines with it’s ID.
Clickable SVG map
I created QetriX Map with SVG in mind. But I wasn’t pleased about how to make it clickable. It requires Raphaël JS library and it’s not as friendly as I would like.
Wrong.
There’s something called “XLink”, which allows creating hyperlinks within XML documents (therefore in SVG as well).
In HTML you can use . And it works simply like that. Any SVG element works as a link – circle, line, polyline, path and more.
In plain SVG you have to also add a proper xlink namespace xmlns:xlink="http://www.w3.org/1999/xlink" in SVG tag, otherwise you’ll get an error message: “XML Parsing Error: prefix not bound to a namespace”.
Example:

HTML code:
- <!DOCTYPE html>
- <html>
- <body>
- <svg version="1.0" width="100" height="100">
- <a xlink:href="#ad"><circle cx="50" cy="50" r="40" stroke="green" stroke-width="4" fill="yellow" /></a>
- </svg>
- </body>
- </html>
SVG code:
- <svg version="1.0" id="svg" xmlns:svg="http://www.w3.org/2000/svg" xmlns="http://www.w3.org/2000/svg" xmlns:xlink="http://www.w3.org/1999/xlink" width="100" height="100">
- <a xlink:href="#c1"><circle cx="50" cy="50" r="40" stroke="green" stroke-width="4" fill="yellow" /></a>
- </svg>
Anyway, not everything is bright and shiny, working CSS doesn’t mean it will behave the same, as in HTML. SVG has it’s own attributes (background become fill, border become stroke) and doesn’t support those I got used to work with in HTML – like z-index. I’d like to highlight a path by changing stroke color and width, but only part of it is visible. It’s because z-index in SVG is fixed by position of the element in XML, so part of the outline is overlapped by nearby element defined further in the XML. The only way is DOM reordering, which is quite expensive (resources-wide).
June and July 2014
As usual, I had quite a lot of stuff going on. First of all, I was working on PHP framework for QetriX. I got it working (and I’m quite satisfied with it), but it would take a lot of effort to finish it completely.
Then I learned how to use location in Objective-C, especially in background. When I was about to finish, Apple announced Swift, so I created a few small apps in it, but unfortunately from the beta Xcode it’s not allowed to publish them to the Store yet.
One of the apps was a database of address points in the Czech Republic. Because I needed various kinds of data, I “accidentally” found a new source of such data for QetriX. I started just with EU (NUTS and LAU areas), but expanded to the US as well. Instead of importing data from TSV right into QetriX, this time I imported it from source CSV to custom table. I hope I would be able to see the data better (because of SQL JOINs and such).
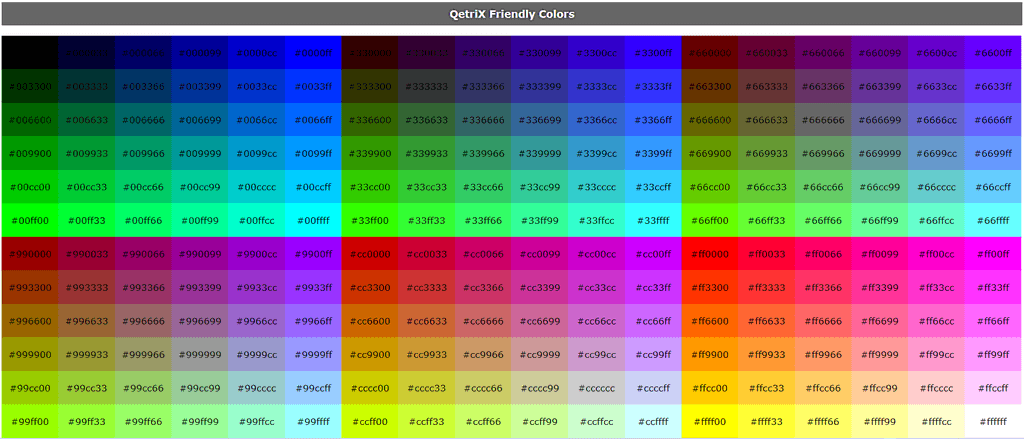
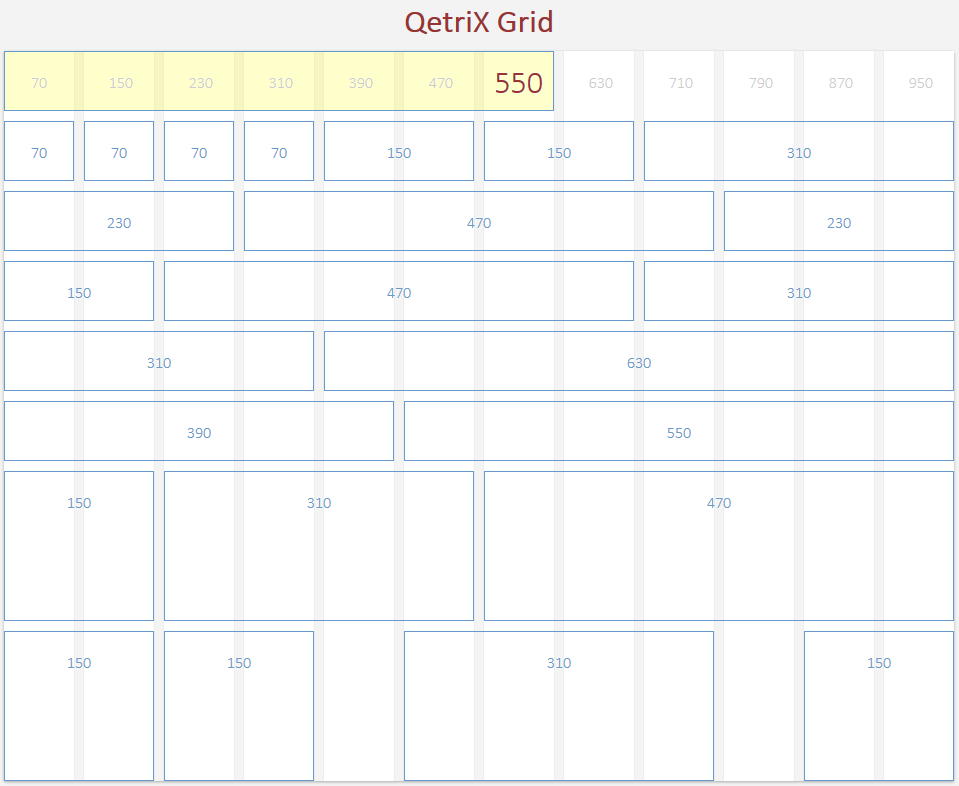
For the mobile app of CZ Address Points I created a QetriX based website. Because it involved some CSS, I also updated reference pages for grid and “friendly” colors – consisting only from pairs of 0, 3, 6, 9, C and F hex numbers. Those are also the 216 web-safe colors.
Because I had to prepare DB and manage Types, I also made progress in QetriX Apmin, analogy to Adminer – a single PHP file for complete management (of QetriX apps).
LESS CSS
Because of my current sort of trip out of my programming comfort zone, I decided for Quiky web app to try something I read a lot about recently – CSS preprocessors. From the triumvirate of most popular ones I chose LESS, because I saw it around me the most.
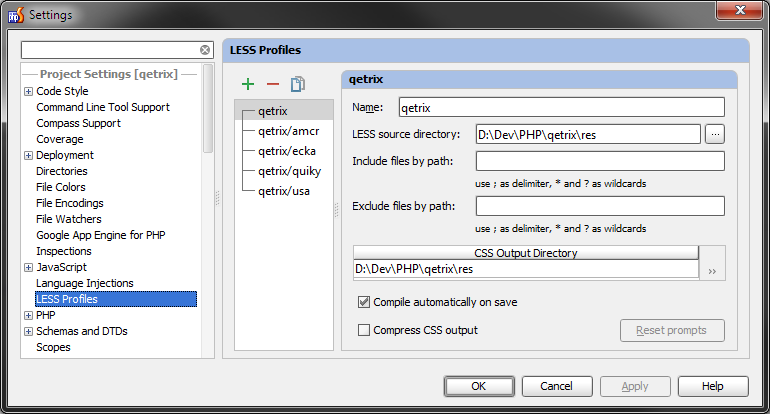
I installed a plugin for PHPStorm (built-in wasn’t working for me), called LESS CSS Compiler. As I would expect, it compiles CSS from LESS source on each save. It requires setup of profiles, specifying where to search for LESS and where to put CSS, which is understandable, but I’m keeping both in the same dir and because each app has it’s own LESS/CSS, it turns to be quite annoying, because I have to do the setup again each time I try to make a new app.
LESS works for me really well, I can say I’m happy to start with that. So if you hesitate, like I did, don’t worry. It will open many new opportunities.
If you create more projects based on the same HTML structure, or you are just not sure about if shades are right, you can define variables for colors and it will definitely saves you more time time than it takes to make it work.